How to Fix a Slow Website (One Image Did Most of It)
A real client case study: the one oversized image behind a slow site, every fix that followed, and a 30-second way to test your own site's speed.

Web Developer & Founder, Ali Samadi Agency
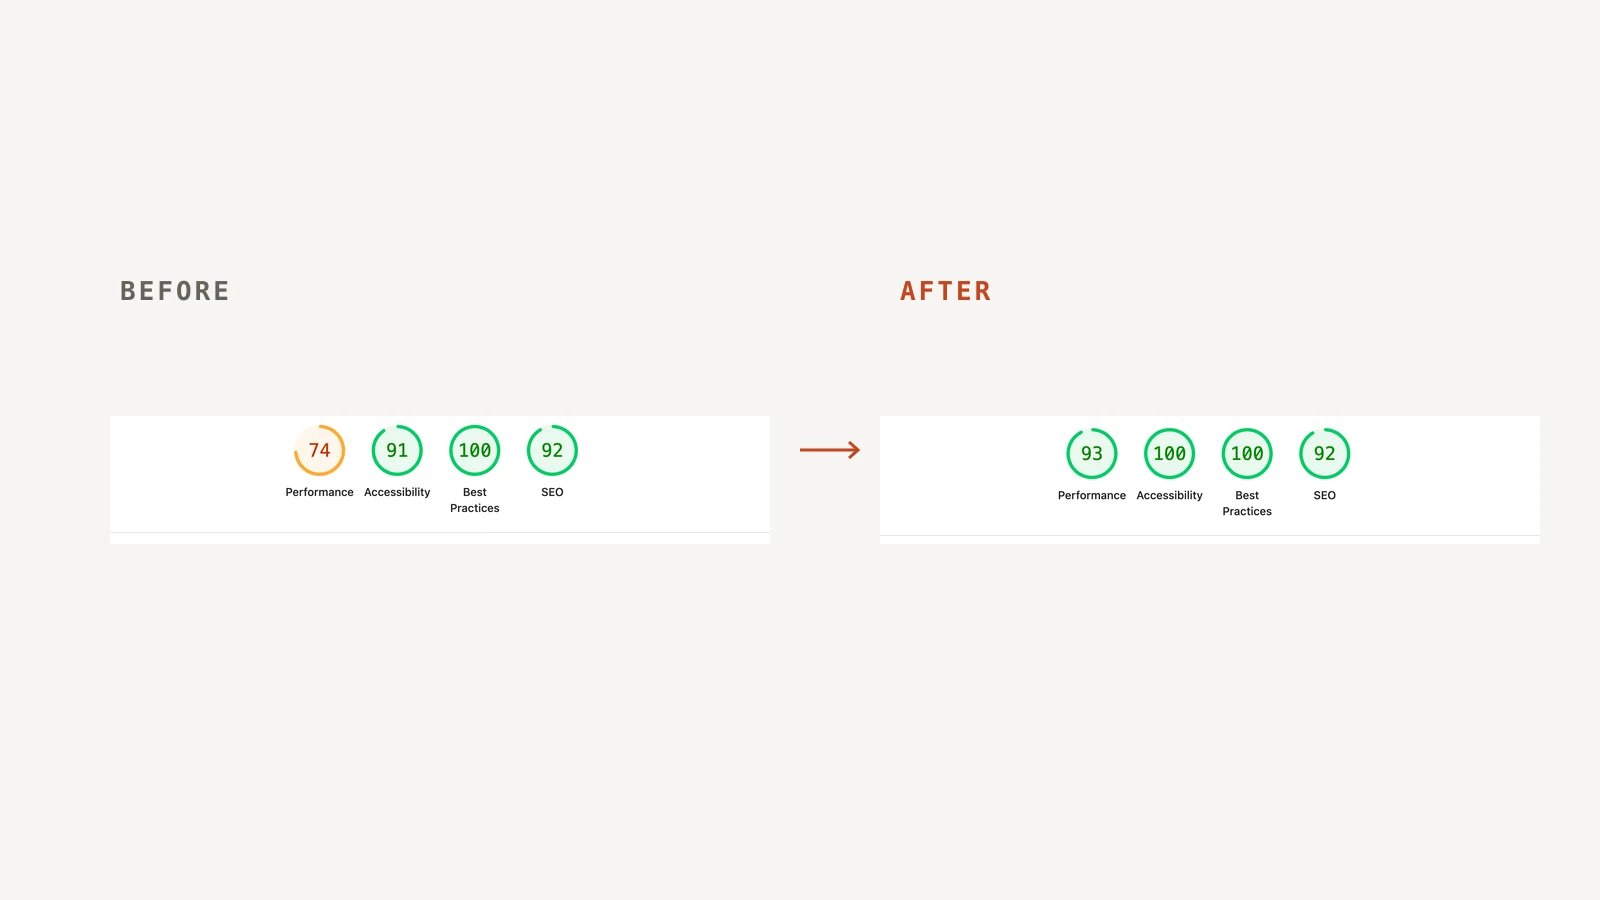
Most “speed up your website” advice reads like a gym membership: nineteen things you should do, all at once, starting Monday. Real websites don’t work that way. Usually one thing is eating most of the load time, and the other eighteen are rounding errors. So here’s how to fix a slow website the honest way — with a real client site, real numbers, and the one file that was doing 90% of the damage.
This is the Hazara Community of Oregon site, a nonprofit I built. It launched looking great and loading slowly. Here’s exactly what I changed and what happened.
The Direct Answer
How do you fix a slow website? Measure first, then fix the thing that actually costs seconds — don’t guess. In practice that’s a short, ordered checklist:
- Run Google Lighthouse and read the report instead of guessing
- Find and fix your largest, heaviest asset first — almost always an image
- Tell the browser what to load first (preload,
fetchpriority, preconnect) - Compress and right-size every other image, and lazy-load below the fold
- Clear the accessibility and best-practices flags while you’re in there
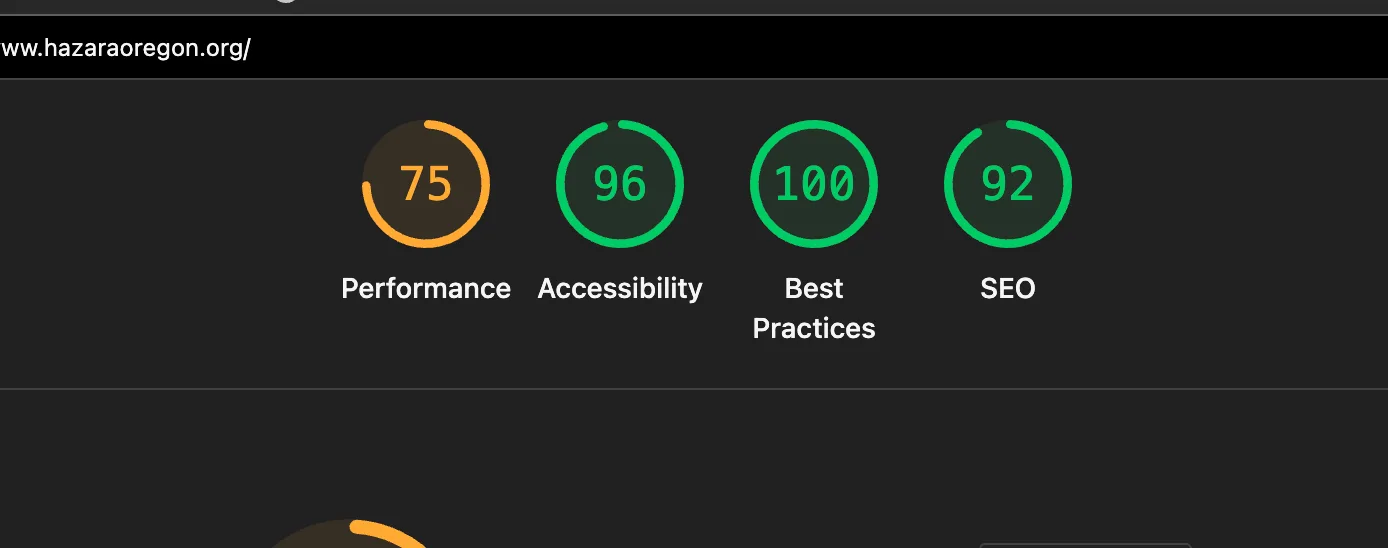
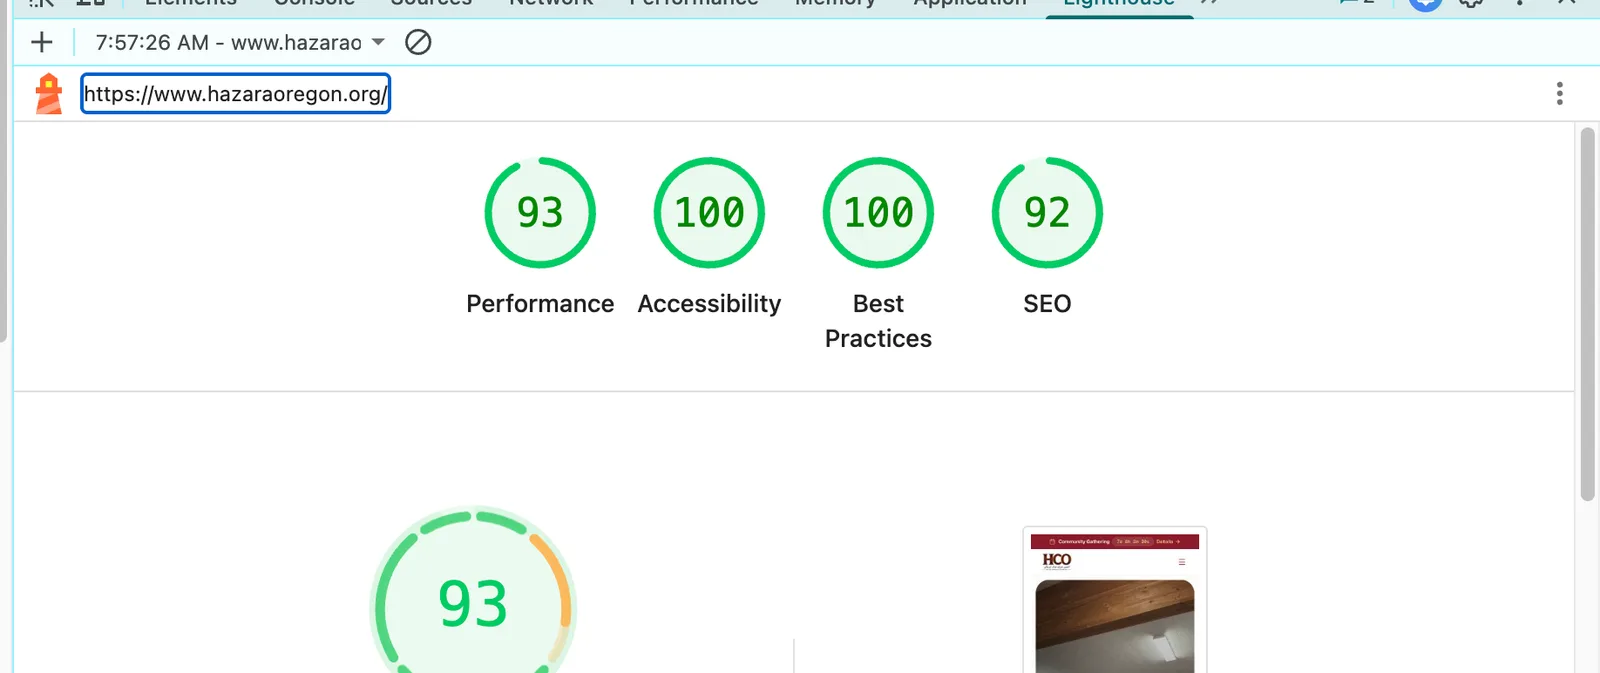
On this site, that took Performance from 74 to 93 and the main image’s load time from 19.9 seconds to about 2 — and step 2 alone did most of it.
Here’s the full before and after, straight from Google Lighthouse (mobile):
| Metric | Before | After |
|---|---|---|
| Performance | 74 | 93 |
| Accessibility | 91 | 100 |
| Best Practices | 100 | 100 |
| SEO | 92 | 92 |
| Largest Contentful Paint (LCP) | 19.9s | ~2s |
| Total Blocking Time | 100ms | 0ms |
What was actually slow
I started by reading the full Lighthouse report instead of guessing — which is the step almost everyone skips. One number stood out like a sore thumb: a Largest Contentful Paint of 19.9 seconds. LCP is how long the main image takes to show up. For a visitor, it’s how long the page looks broken.
The cause wasn’t a mystery once I looked. It was a single file: the homepage hero image was a 2.7 MB raw JPG, 4032×3024 — straight off a phone camera. On a mobile connection, that one image was roughly 90% of the load problem. Everything else was ordinary stuff stacked on top: images with no set dimensions, tap targets too small for a thumb, and a few links Google couldn’t read.
The five fixes, in order
1. Fixed the one image that mattered most
I converted the 2.7 MB hero JPG to WebP — a modern, far smaller format — and resized it to something sane. 2,779 KB became 231 KB. That one change dropped LCP from 19.9s to 8.9s. Half the problem, one file.
2. Told the browser what to load first
A fast image is wasted if the browser finds it late. So I added a fetchpriority="high" hint and eager loading on the hero so it downloads immediately, a preload in the page head so the browser starts fetching it before it finishes reading the page, and a preconnect to the image host so the network handshake happens in advance. Small hints, real seconds.
3. Optimized every other image
Not just the hero — all 24 images across the site were re-encoded to WebP and right-sized. Total image weight went 5.71 MB to 3.21 MB, a 43% cut. Some raw photos shrank by up to 90%.
4. Made everything below the fold lazy-load
Images further down the page now load only as the visitor scrolls to them, so the first screen isn’t waiting on things nobody’s looking at yet. The hero stays eager on purpose — lazy-loading the main image would slow the exact thing I just fixed.
5. Cleared the accessibility flags
Accessibility went 91 to 100 by fixing the small stuff that adds up: carousel dots too tiny to tap reliably (enlarged to a proper 24px target), six “Learn More” links that screen readers couldn’t tell apart (now they say where they go), missing image dimensions so the layout stops jumping, and a logo link with no accessible label.
The honest part: what’s left
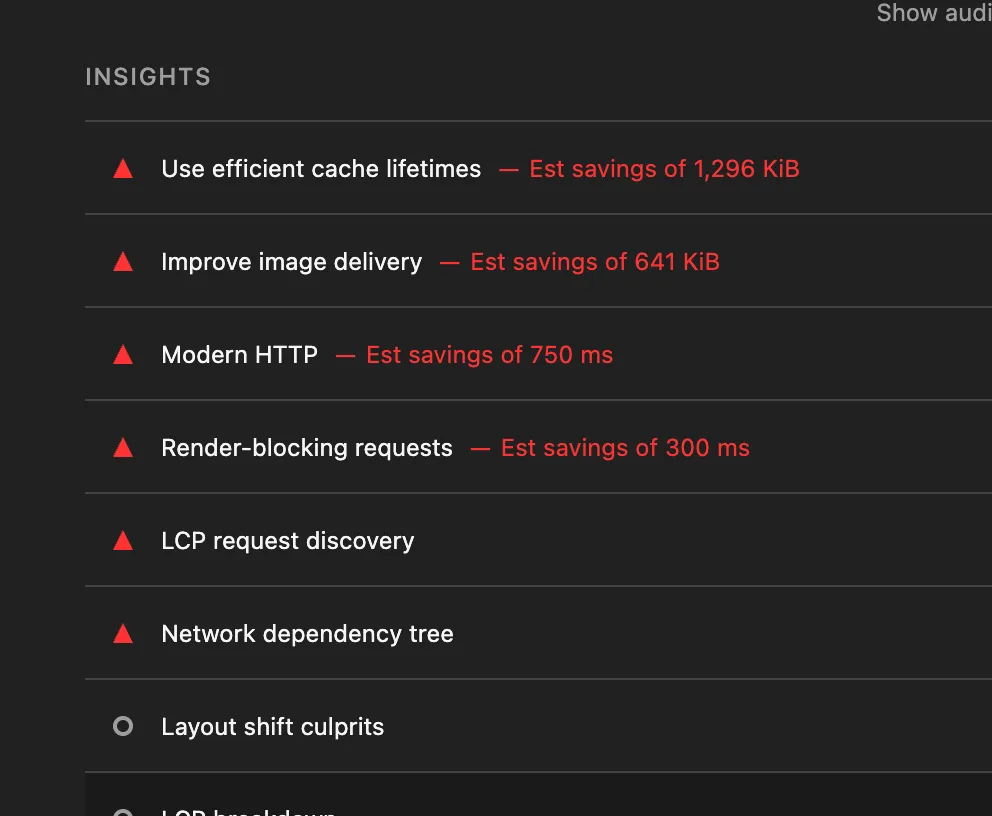
The site is fast, but Lighthouse still flags two things I can’t fix in code alone: cache lifetimes and modern HTTP. Both come from where the images are currently hosted — a public dev URL that doesn’t send long cache headers or serve over the newest protocols.
The fix there is infrastructure, not code: serving the images through a proper Cloudflare custom domain, which unlocks long-term caching, HTTP/2 and 3, and on-the-fly resizing in one move. That’s the next lever if we want to push Performance past 93. I’d rather tell you that than pretend 93 is a perfect score.
How to check any website’s speed yourself
You don’t have to take my word for any of this — and you shouldn’t. Here’s how to run the exact same test on any site, including your own, in about 30 seconds:
- Open the website in Google Chrome.
- Right-click anywhere on the page and choose Inspect (or press F12).
- In the panel that opens, click the Lighthouse tab (it may be behind the
»menu). - Choose Mobile, then click Analyze page load.
- Wait about 20 seconds. You’ll get the same four scores — Performance, Accessibility, Best Practices, SEO — that I’ve been quoting.
Run it on your own site right now. If Performance is green, good. If it’s orange or red, you’ve just found the thing this whole post is about — and the biggest culprit is very likely one oversized image.
The opinion, backed by the numbers
Here’s what I’ll stand behind: the biggest performance win is almost never clever — it’s the one big thing you measured instead of guessed. A folder of nineteen micro-optimizations would not have touched this site the way deleting 2.5 MB from a single image did. Measure first, fix the thing that actually costs seconds, and build lean so it stays fast.
And the part that costs me nothing to admit: if your site already scores green, you don’t need me to “optimize” it. Some agencies will sell you a speed audit for a site that’s already fast. Run Lighthouse first. If it’s green, keep your money.
Straight answers
How do I fix a slow website? Run Google Lighthouse, find your single heaviest asset (usually an image), fix that first, then compress the rest, lazy-load below the fold, and add browser loading hints. Measuring before touching anything is the step that saves you from optimizing the wrong thing.
What usually makes a website slow? One oversized image more often than anything else, followed by cheap hosting, no caching or CDN, and script bloat. On this site a single 2.7 MB hero image was about 90% of the problem.
How do I reduce Largest Contentful Paint (LCP)? Shrink and modernize your main image (WebP, right-sized), then preload it and mark it fetchpriority="high" so the browser fetches it immediately. That took this site’s LCP from 19.9s to about 2s.
How do I check my website’s speed? Open the site in Chrome, right-click → Inspect → the Lighthouse tab → choose Mobile → Analyze page load. It’s free and takes about 30 seconds. Read more in why your website is slow and how to test it.
Does image file size really matter that much? Yes — more than almost anything else. Images are usually the heaviest thing on a page, and a single unoptimized photo can add tens of megabytes and many seconds on mobile.
That’s the whole job: measure, fix the big thing, tidy the rest, and be honest about what’s left. It’s the standard I hold every site I build to, because your visitors judge speed even if they’d never use the word “LCP.” If you want a site built fast from day one — or a slow one rescued like this — the pricing page has the numbers, or the deeper explainer on why websites get slow is a good next read.
Image credits: Lighthouse screenshots from the actual audits of hazaraoregon.org — run them yourself and you’ll get the same numbers.